


Votes are still being counted in the key battleground states that will decide the election.
Mr Trump has been projected to win Florida, Ohio, Texas and Iowa already, but Mr Biden has taken Michigan – a state the President won in 2016 – and there are tight races still under way in Arizona, Pennsylvania, North Carolina and Georgia.
So far, Mr Biden has 243 electoral college votes and Mr Trump has 214. To win the presidency 270 votes are needed.
But it may be a day or more until we know the final outcome, as full results for seven states are yet to be projected. The full list along with the number of electoral college votes they carry is:
- Pennsylvania – 20
- Georgia – 16
- North Carolina – 15
- Arizona – 11
- Wisconsin – 10
- Nevada – 6
- Alaska – 3
This map will be updated with live results, and we’ll be adding more graphics and analysis to help explain them as they come in.
If you can’t see the map click or tap here.
Mr Biden is currently leading the national popular vote with 50.3% to Mr Trump’s 48.1%, a lead of almost 3 million votes.
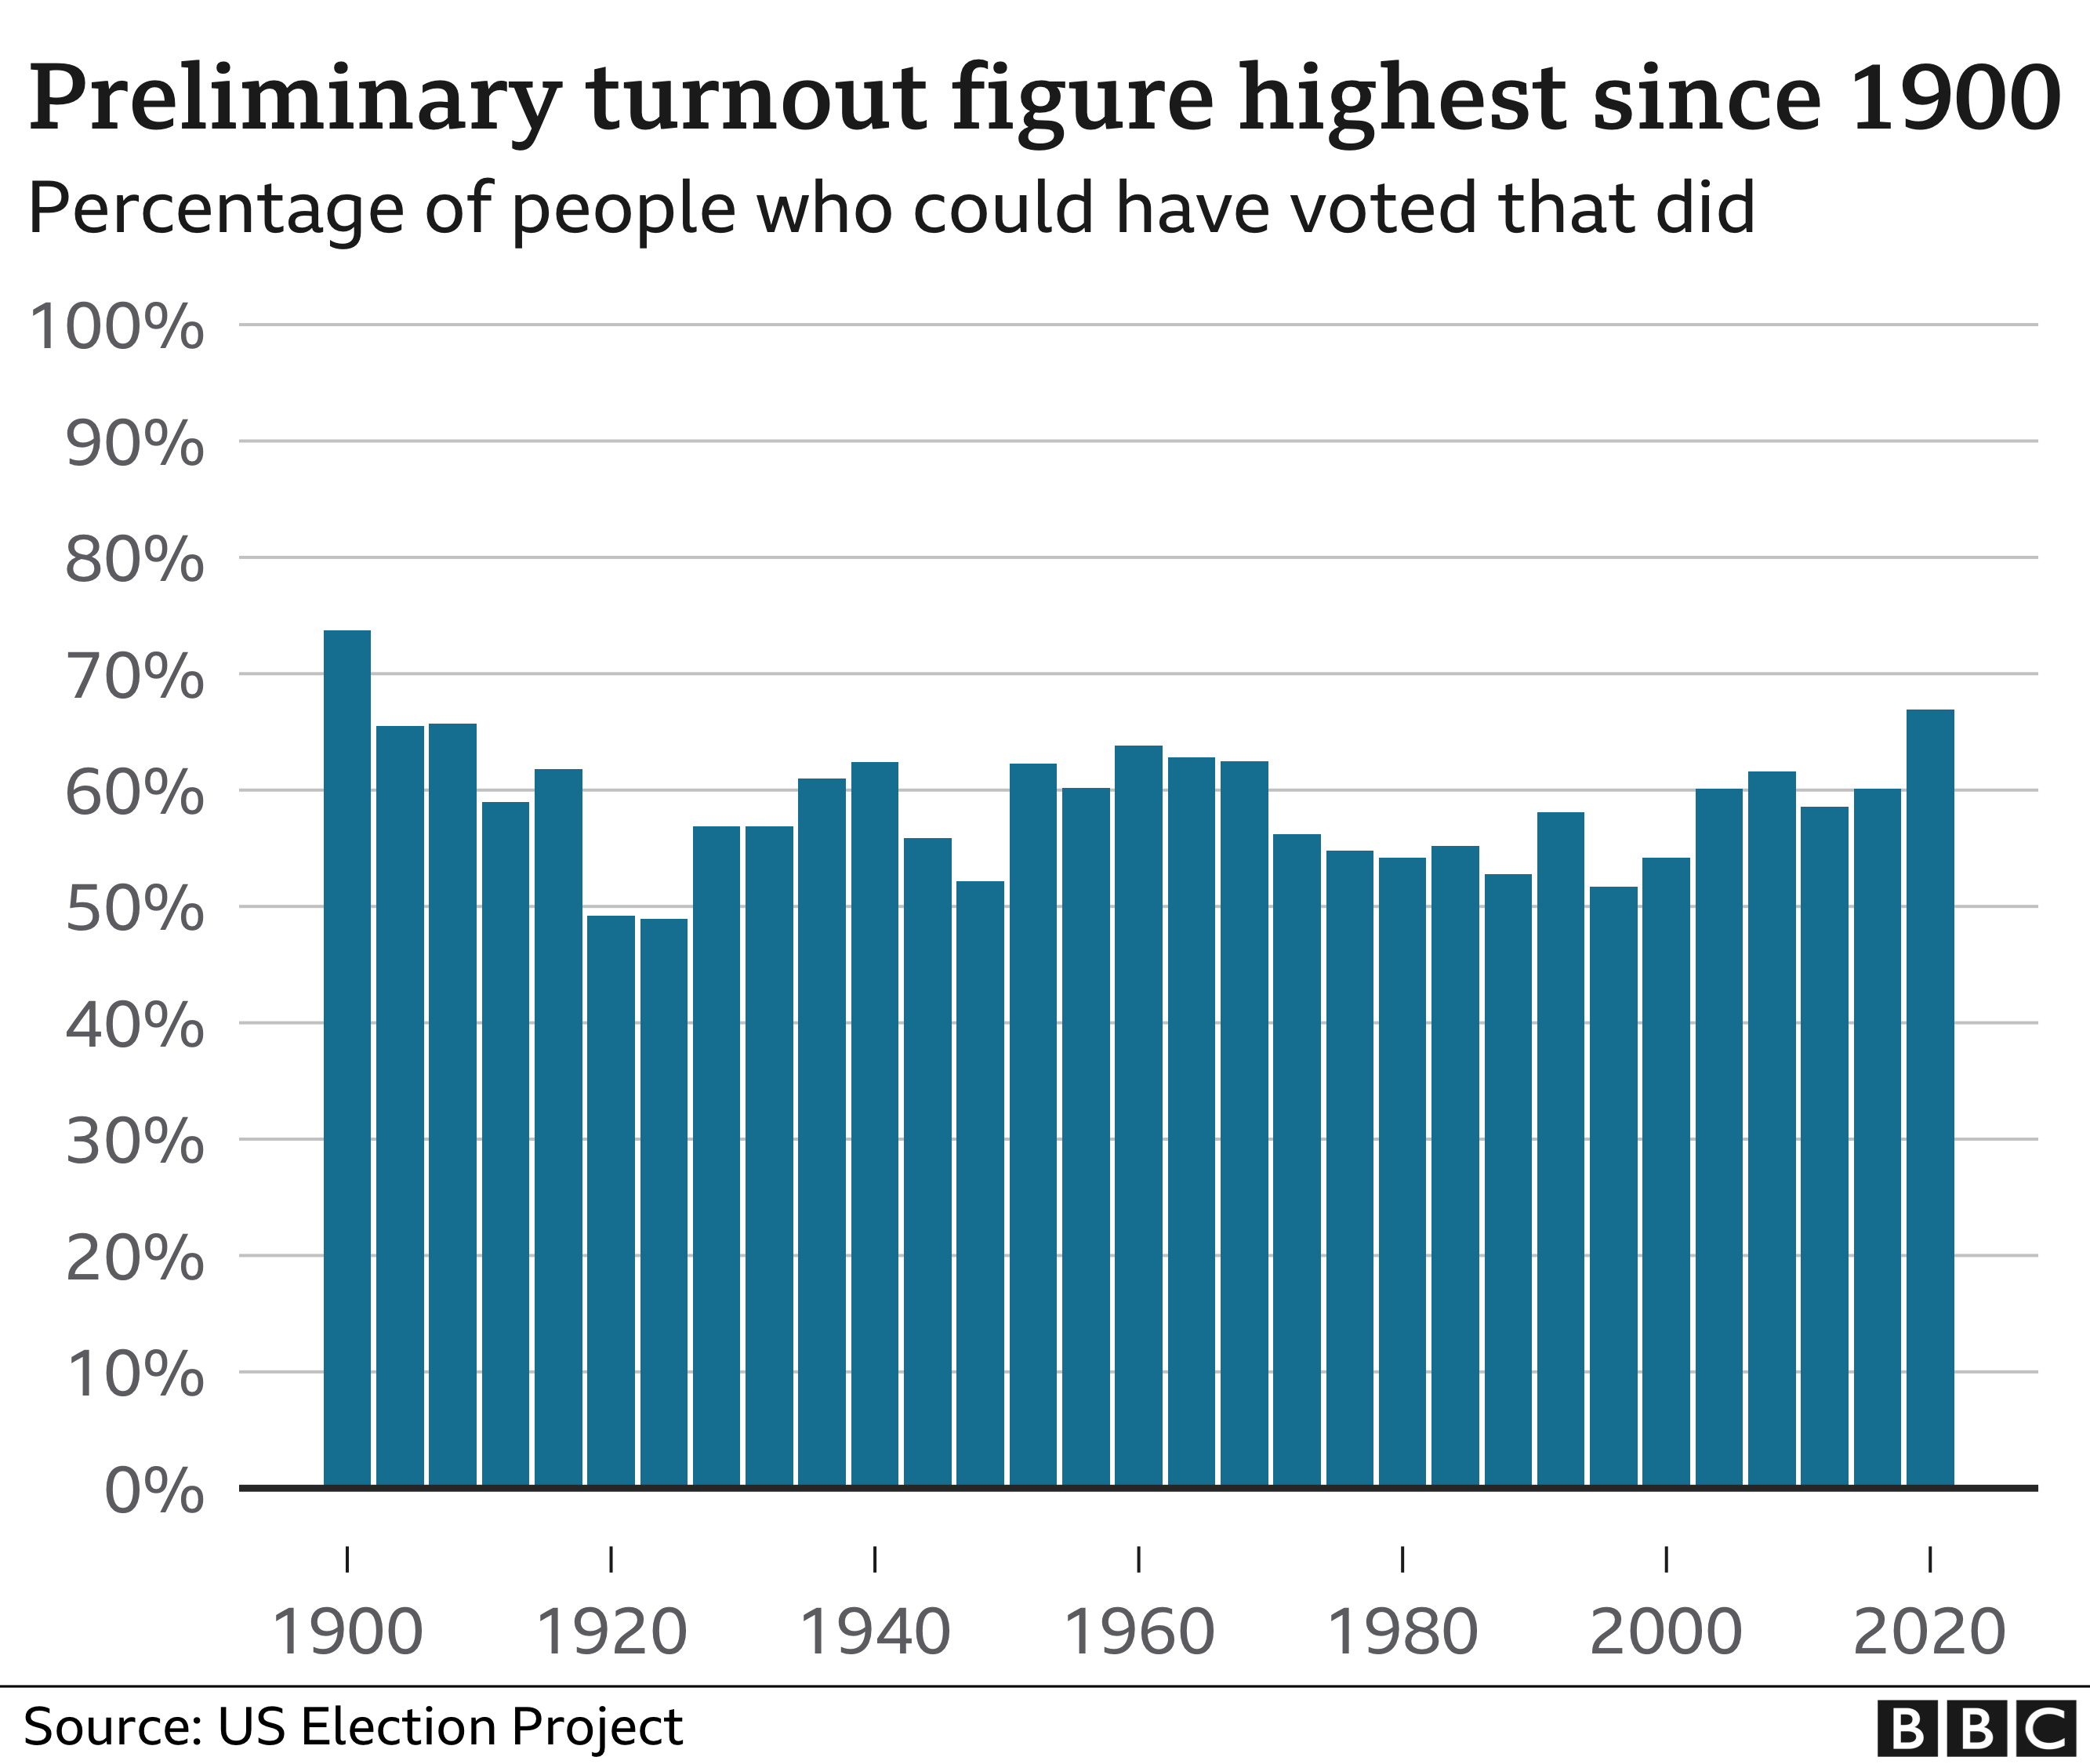
Preliminary figures show the highest turnout since 1900, with 66.9% of eligible voters turning out compared with 60.1% in 2016.
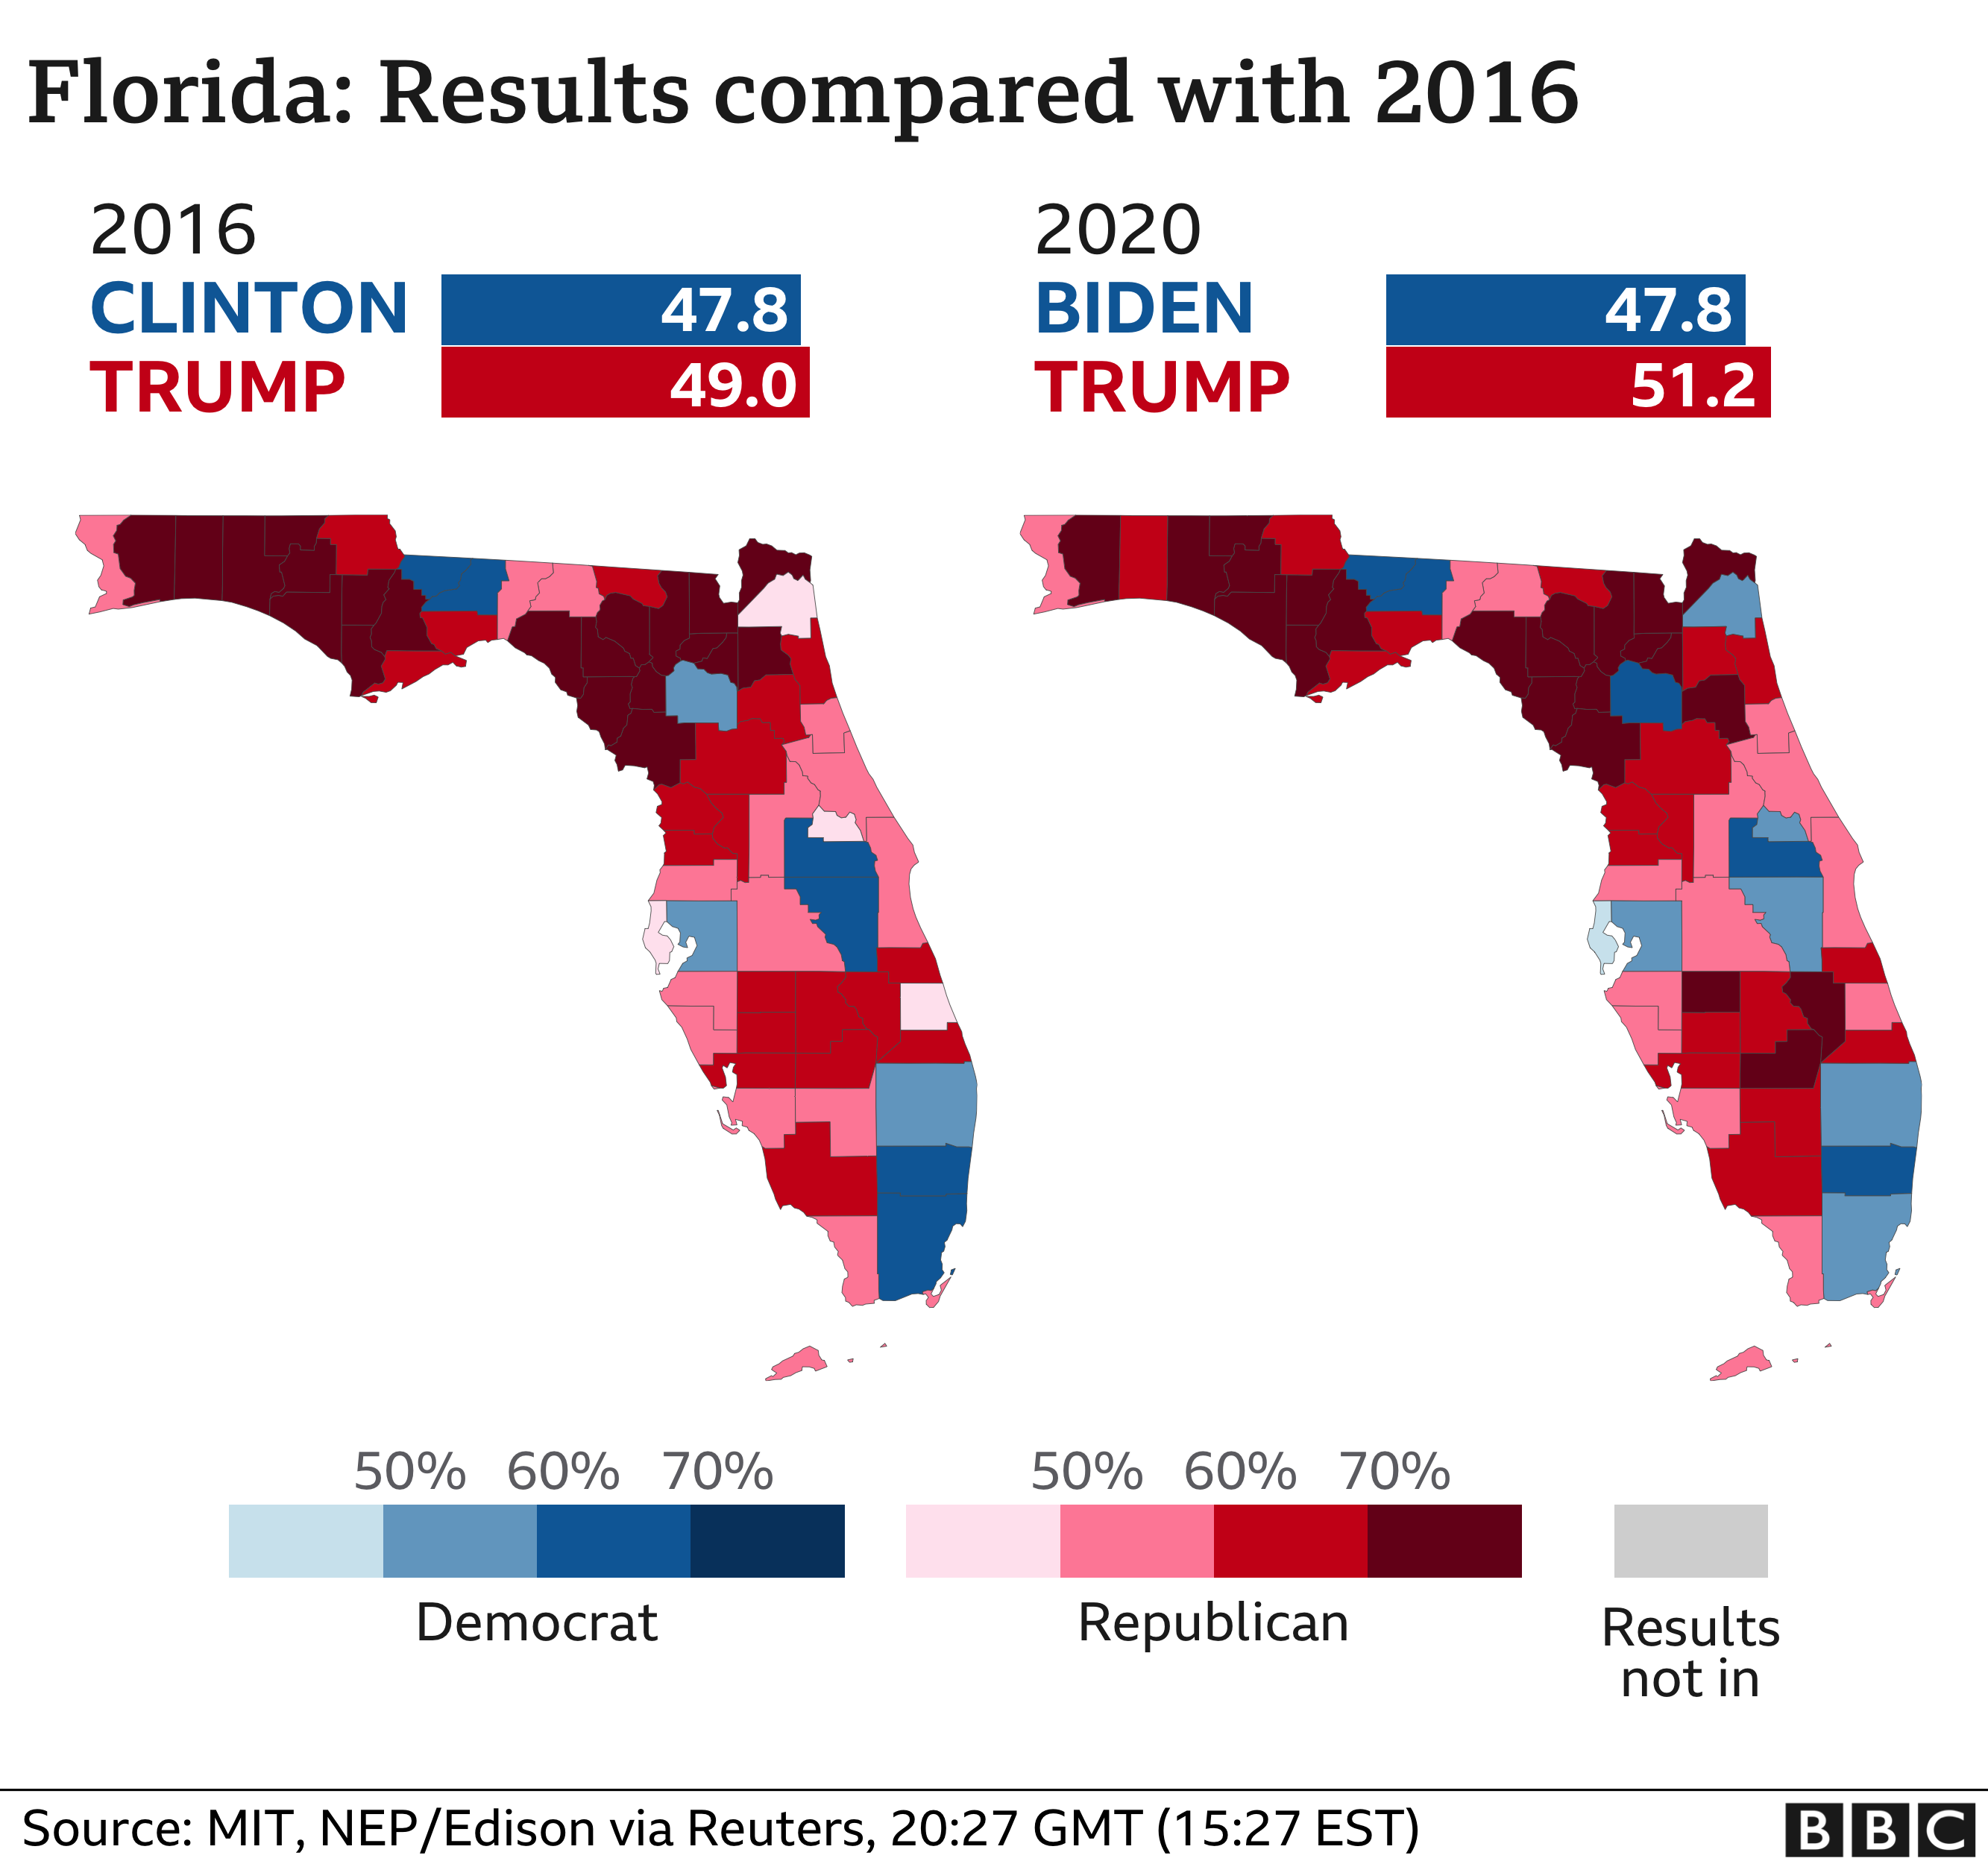
How Trump kept hold of Florida
Mr Trump has been projected to win the closely-fought state of Florida, with 51% of the vote compared with Mr Biden’s 48%.
The president gained two points on his victory in the state in 2016, while Mr Biden failed to improve upon the tally recorded by Hillary Clinton.
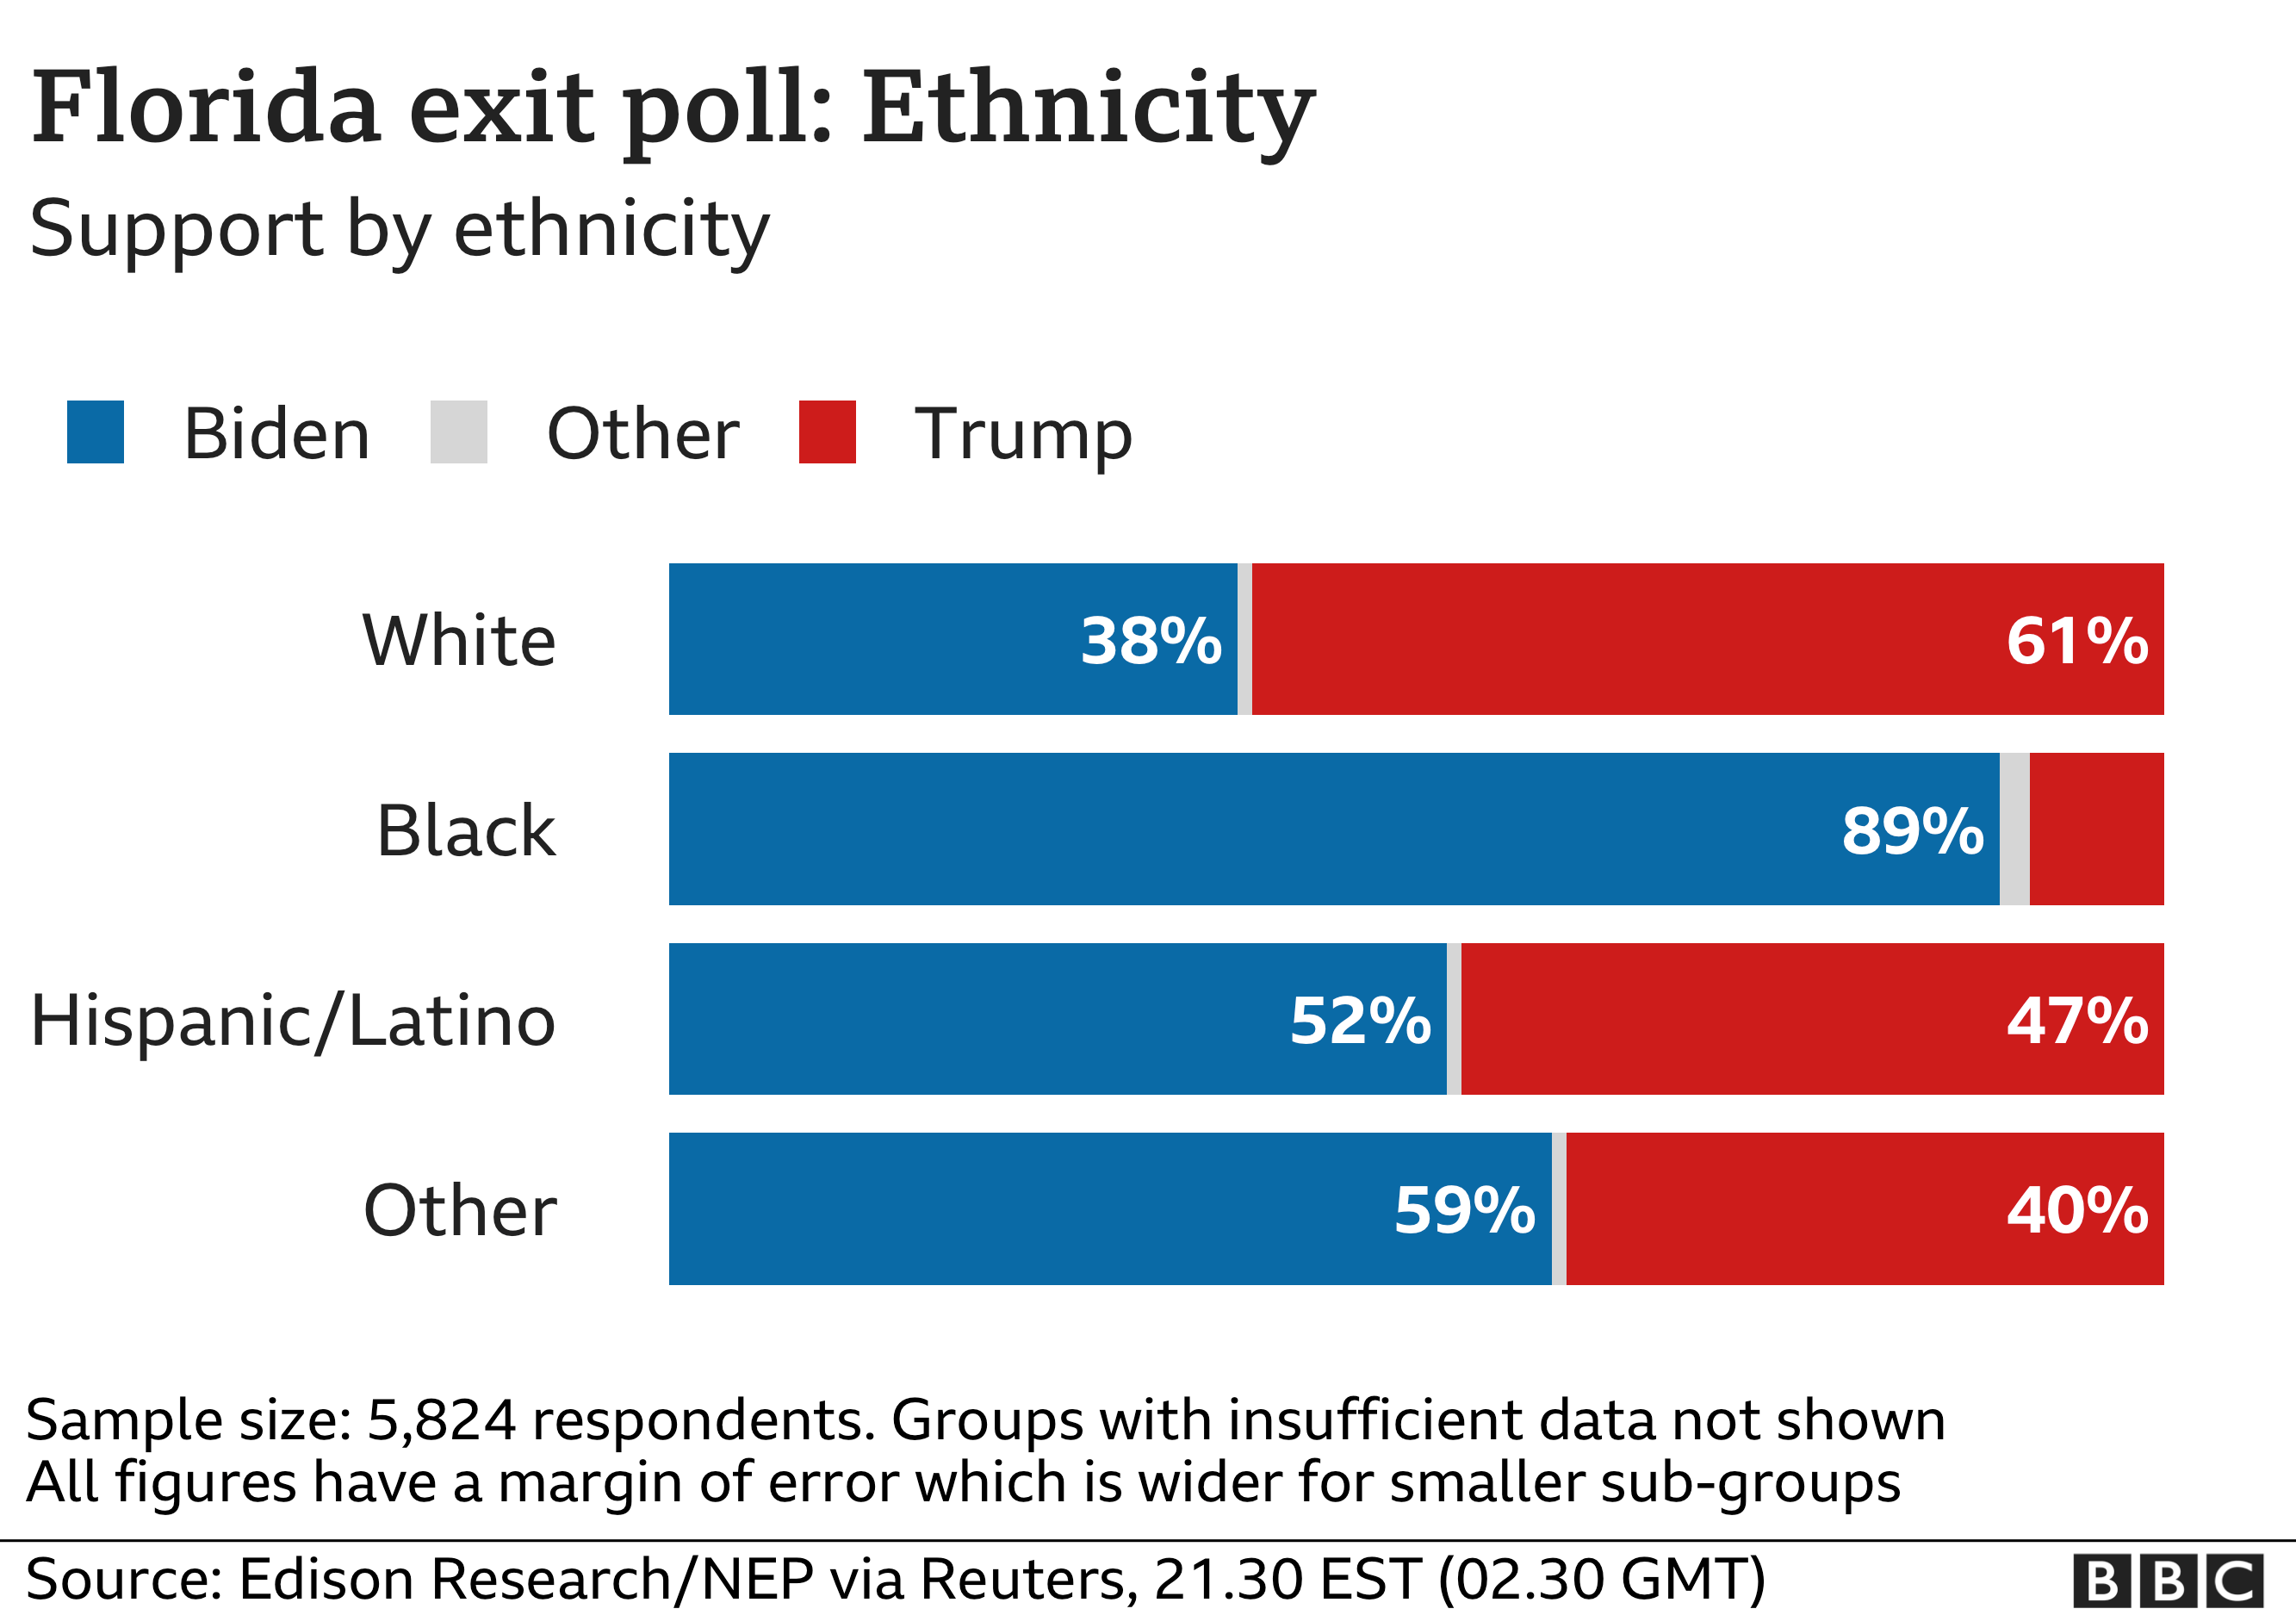
Exit poll estimates put President Trump on a 61% share of the white vote in Florida.
Mr Biden appears to have made up ground on Hillary Clinton’s performance with this demographic in 2016.
However, the president is also estimated to have gained 12 points among Latino voters, bringing him nearly level with Mr Biden among that sizeable group.
Looking at the split by age, Mr Biden appears to have an increased share of the vote among seniors.
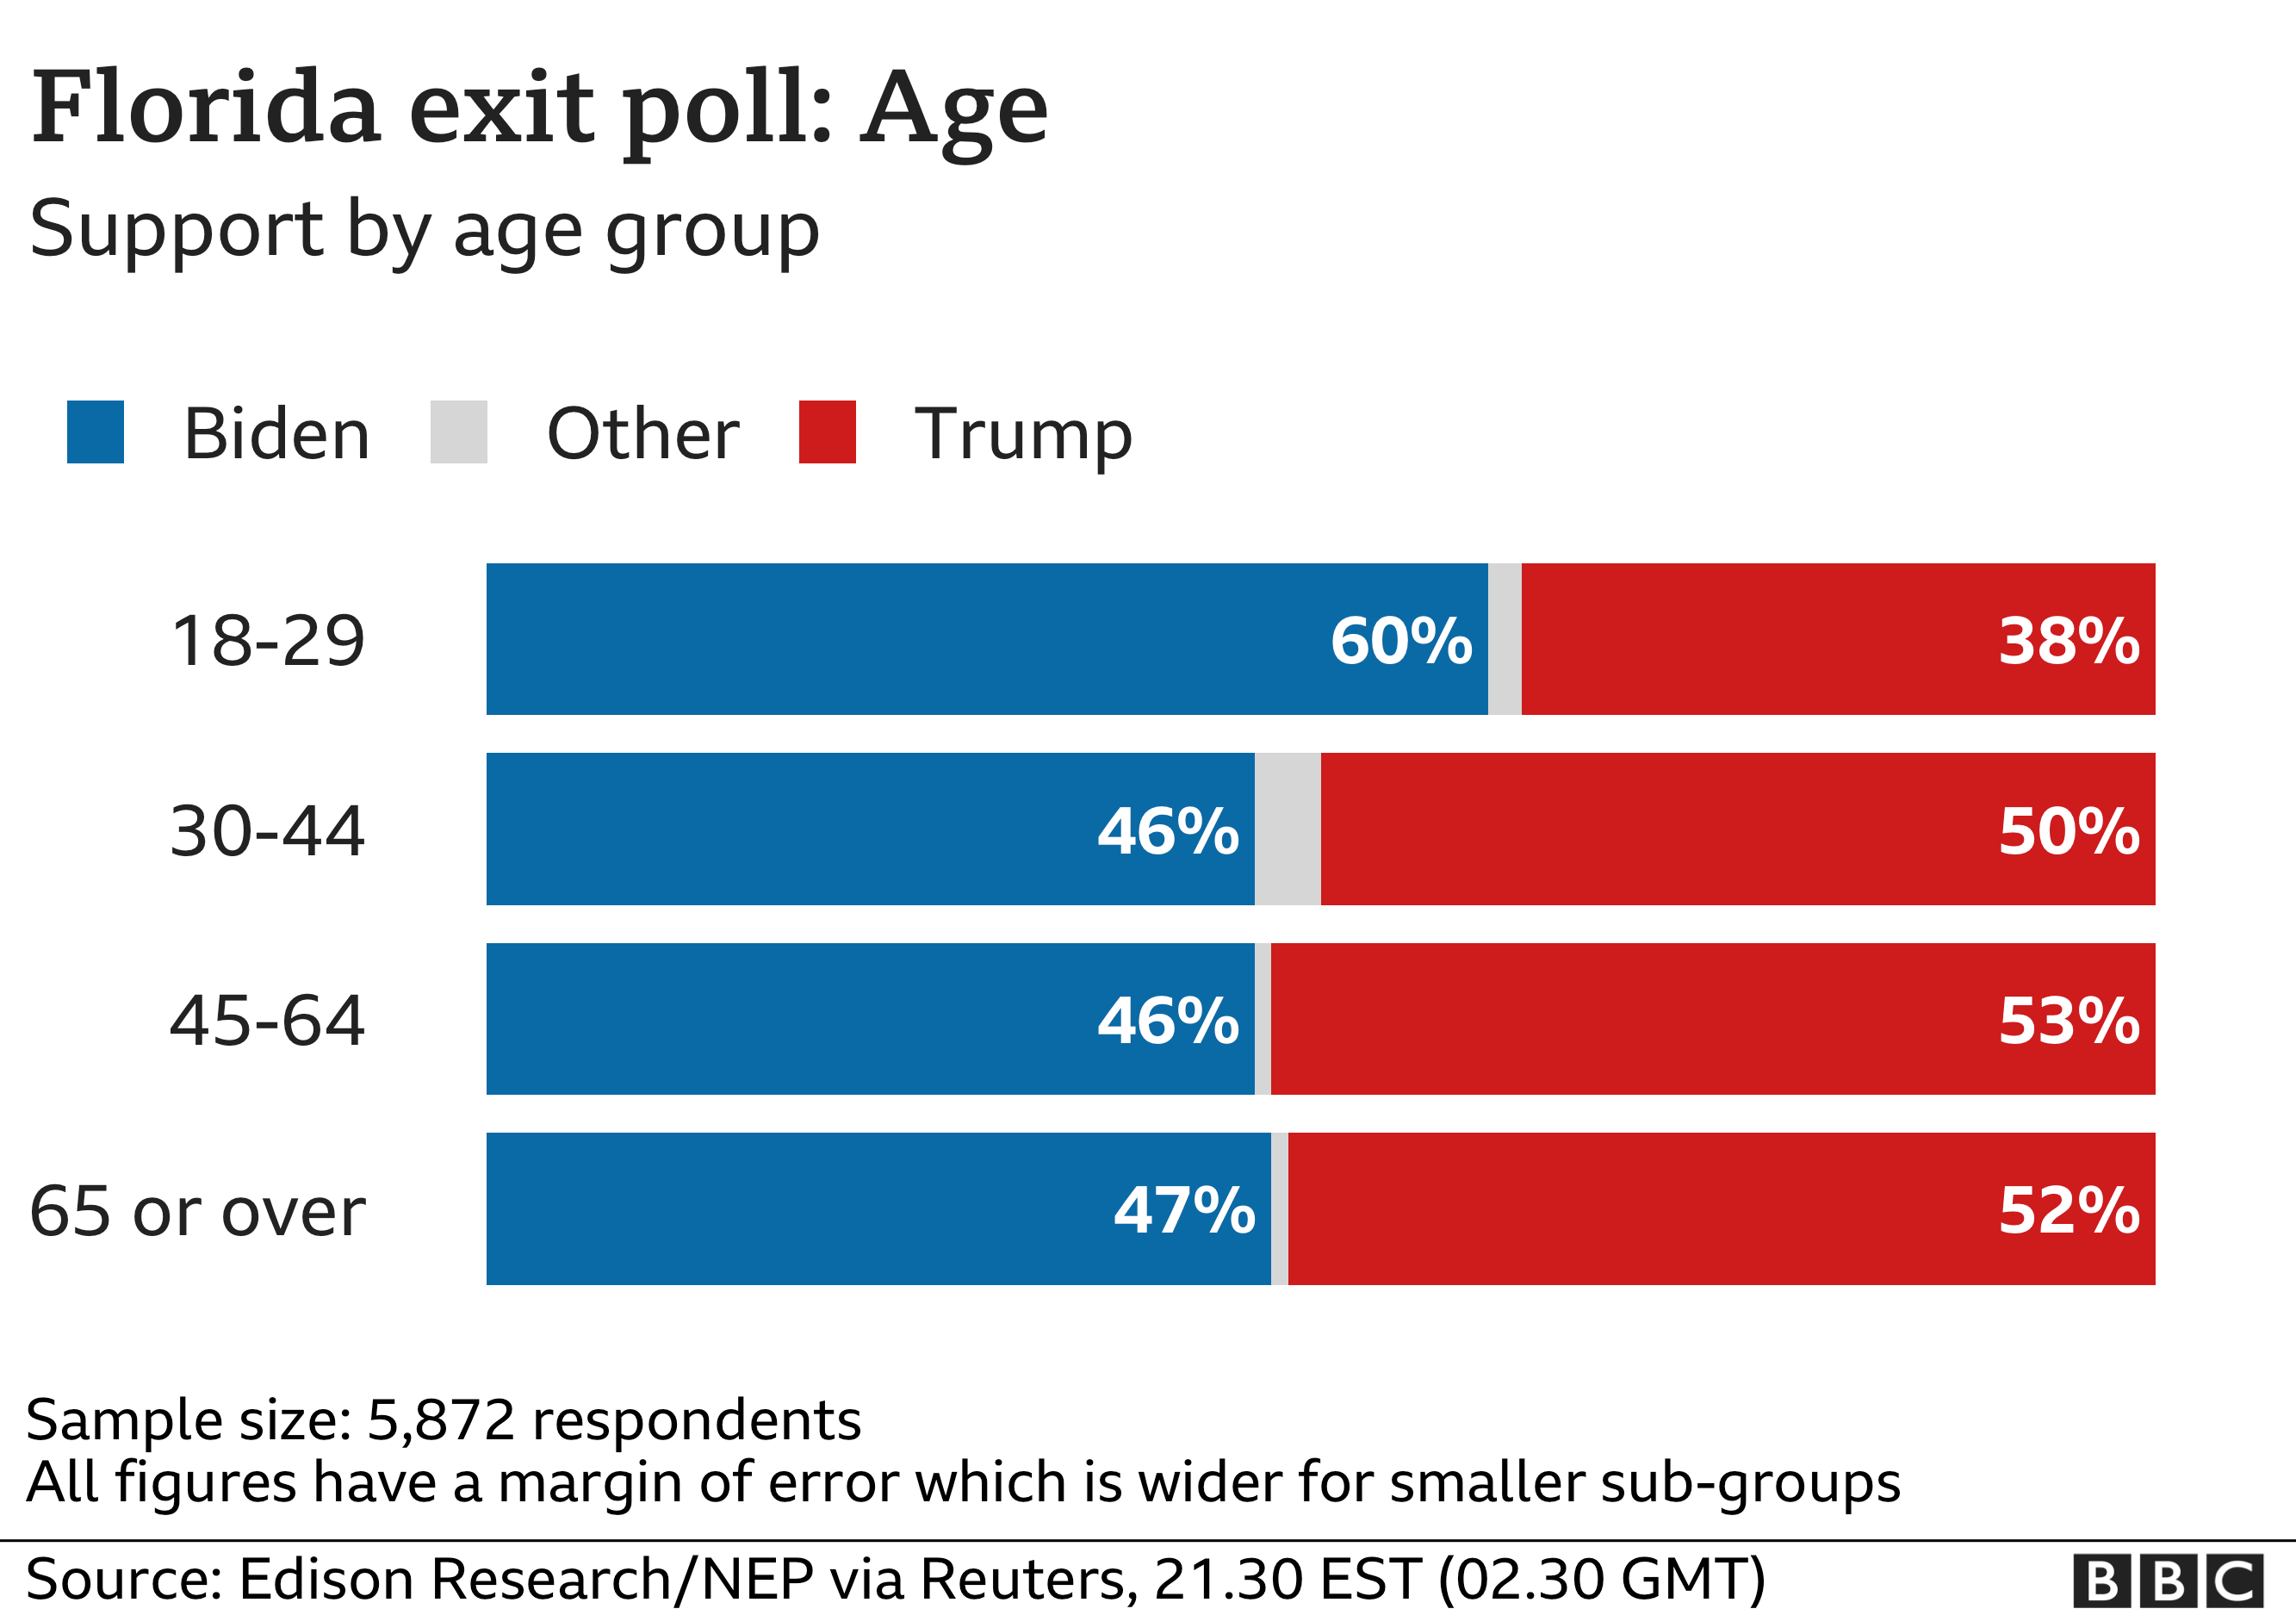
The latest exit poll figures suggest he is seven points up in the 65+ group compared to Mrs Clinton’s share in 2016.
But that gain has been offset by losses in the 30-44 age-group where Mr Trump is up 11 points on last time.
Key details from the exit poll
Exit poll data from across the United States is giving a glimpse into voters’ priorities and an indication of how different demographic groups have cast their ballots.
The figures suggest the proportion of total voters who are white has fallen by six percentage points on 2016, while remaining the largest group by ethnicity.
The proportion of white voters backing Mr Biden has risen by five points on Hillary Clinton’s figure at the last election but Mr Trump still takes the largest share of this group, the preliminary polling suggests.
Meanwhile, Mr Biden appears to have gained support among under 30s and the middle-aged.
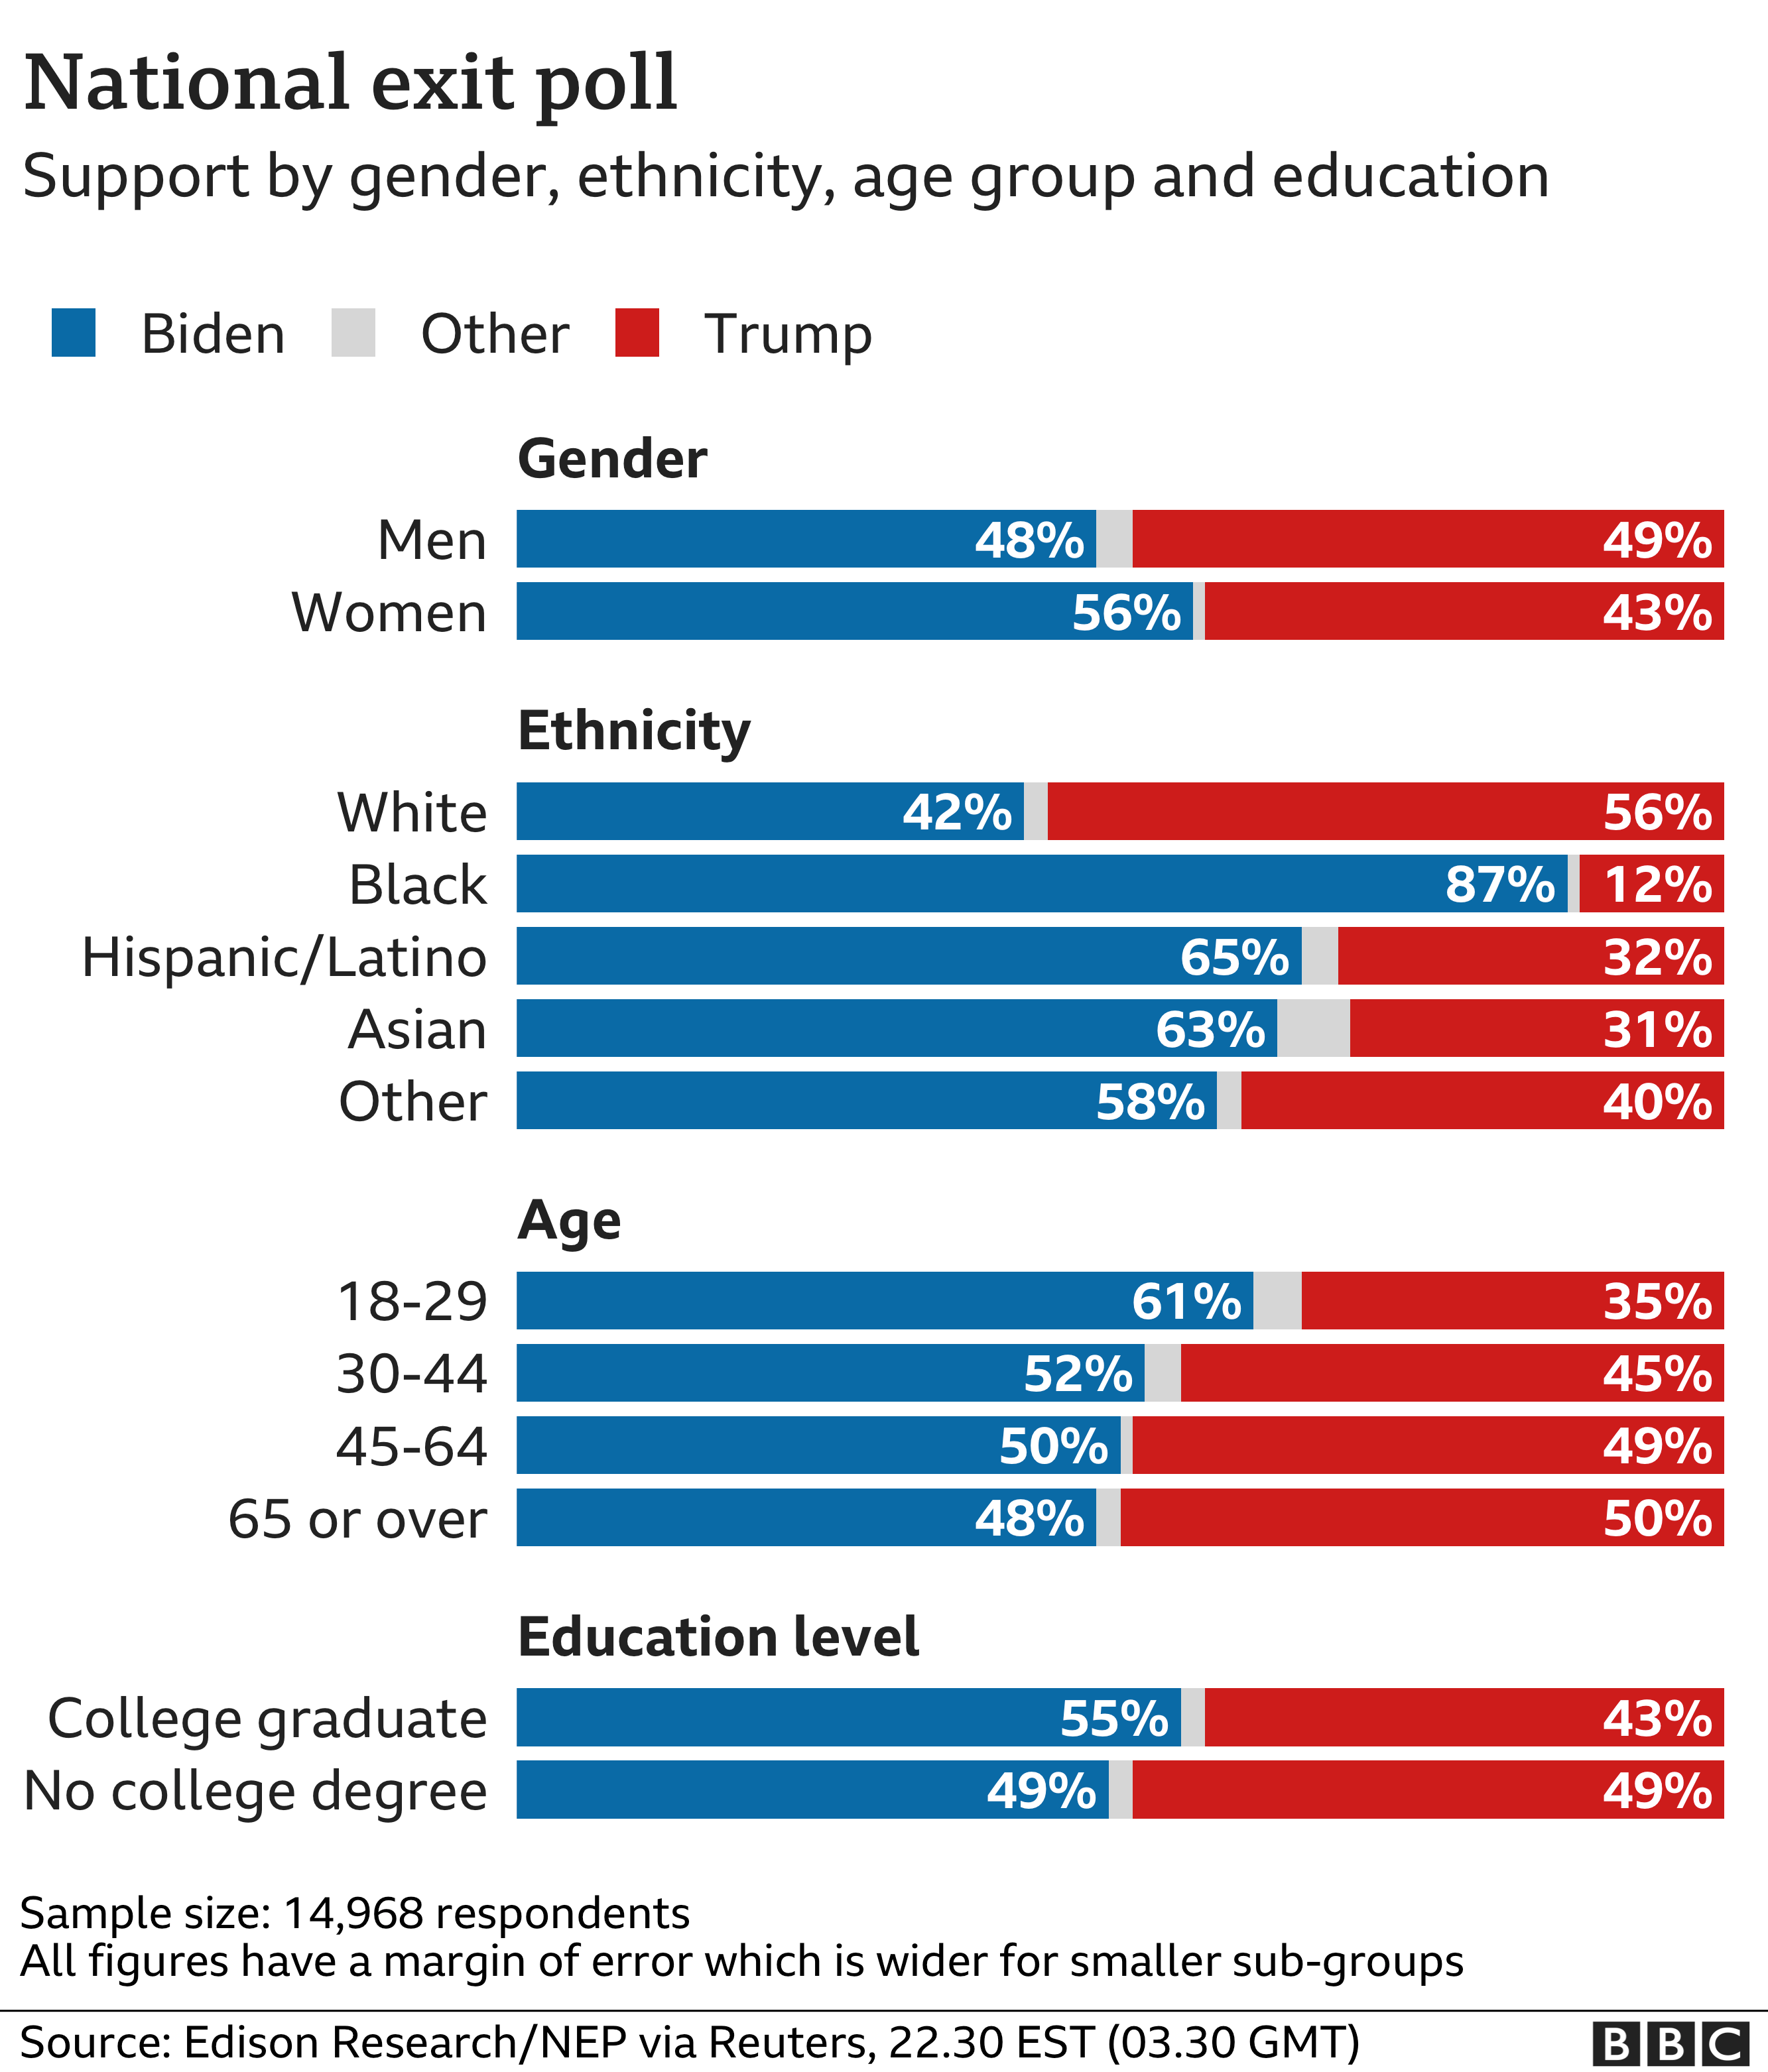
The exit polls are carried out across the US by Edison Research and are a combination of election day interviews and telephone polling, designed to reach early and absentee voters.
What voters thought about the key issues
Nationally, more than third of voters said the economy was the most important issue in deciding who to choose as president, with a further two in 10 naming racial inequality and 17% saying the coronavirus pandemic.
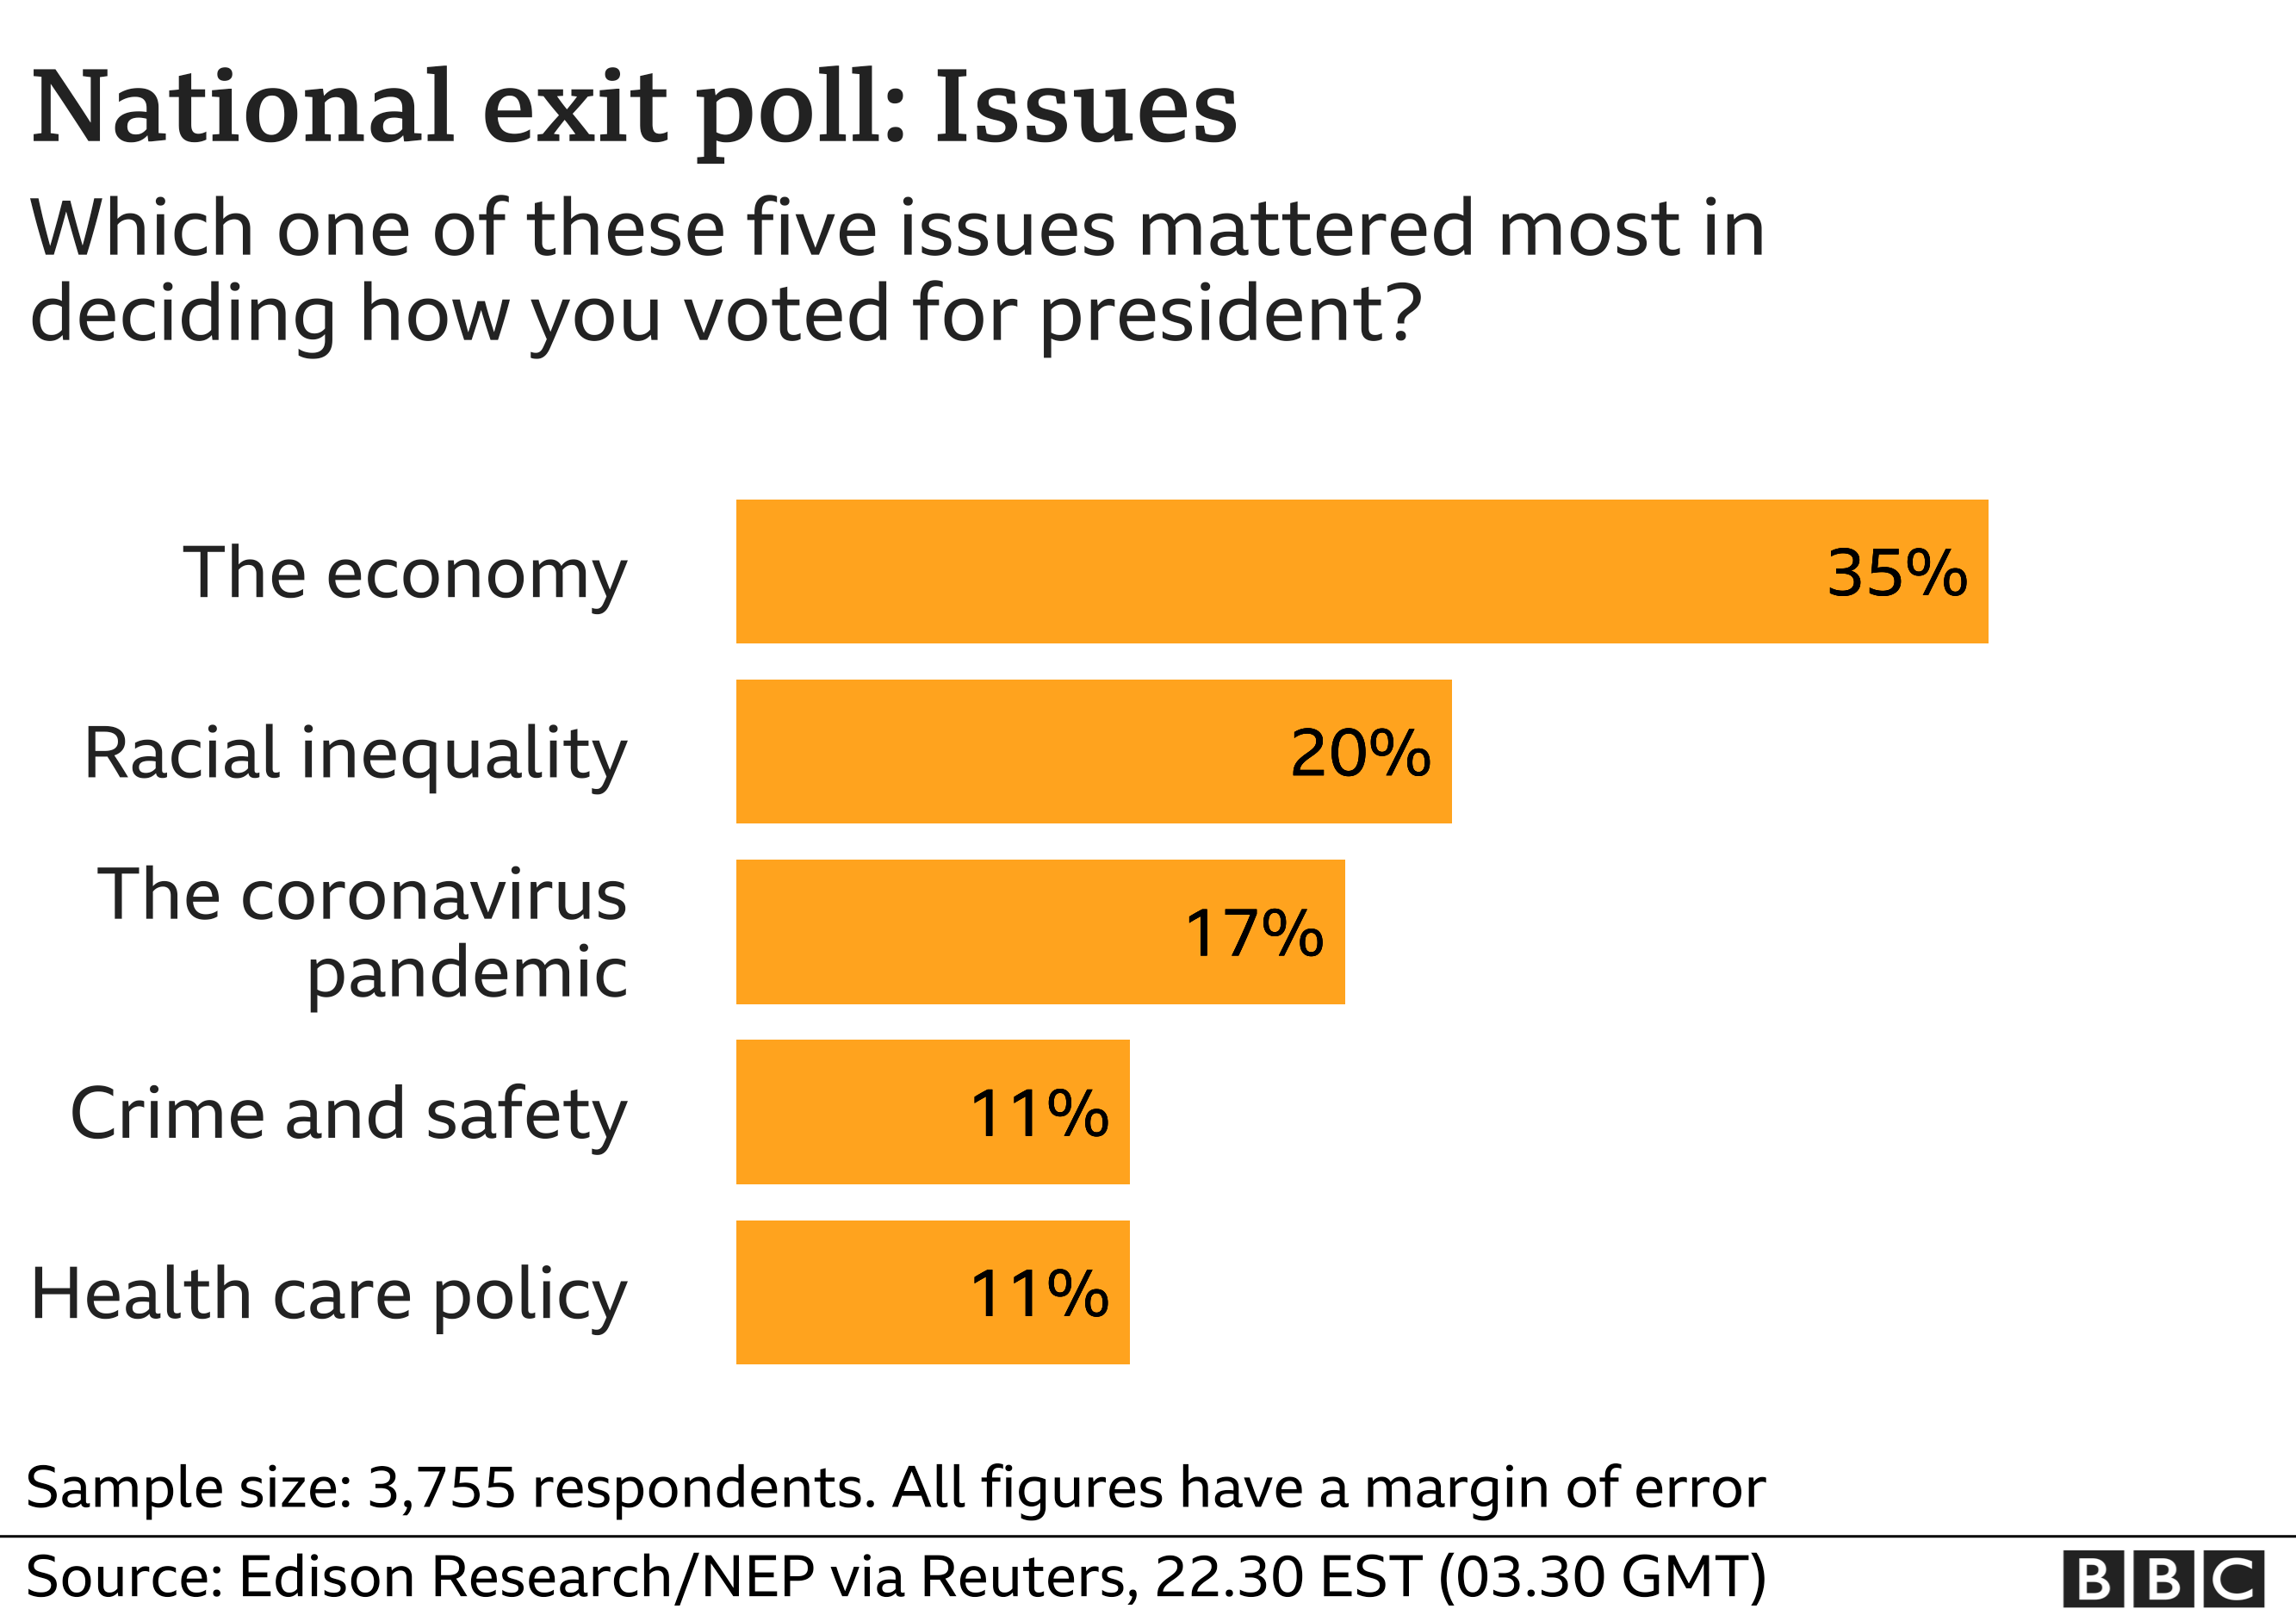
However the issues were split along partisan lines with more than four times as many Trump voters saying the economy was the deciding factor, and Biden voters answering racial inequality and the virus.
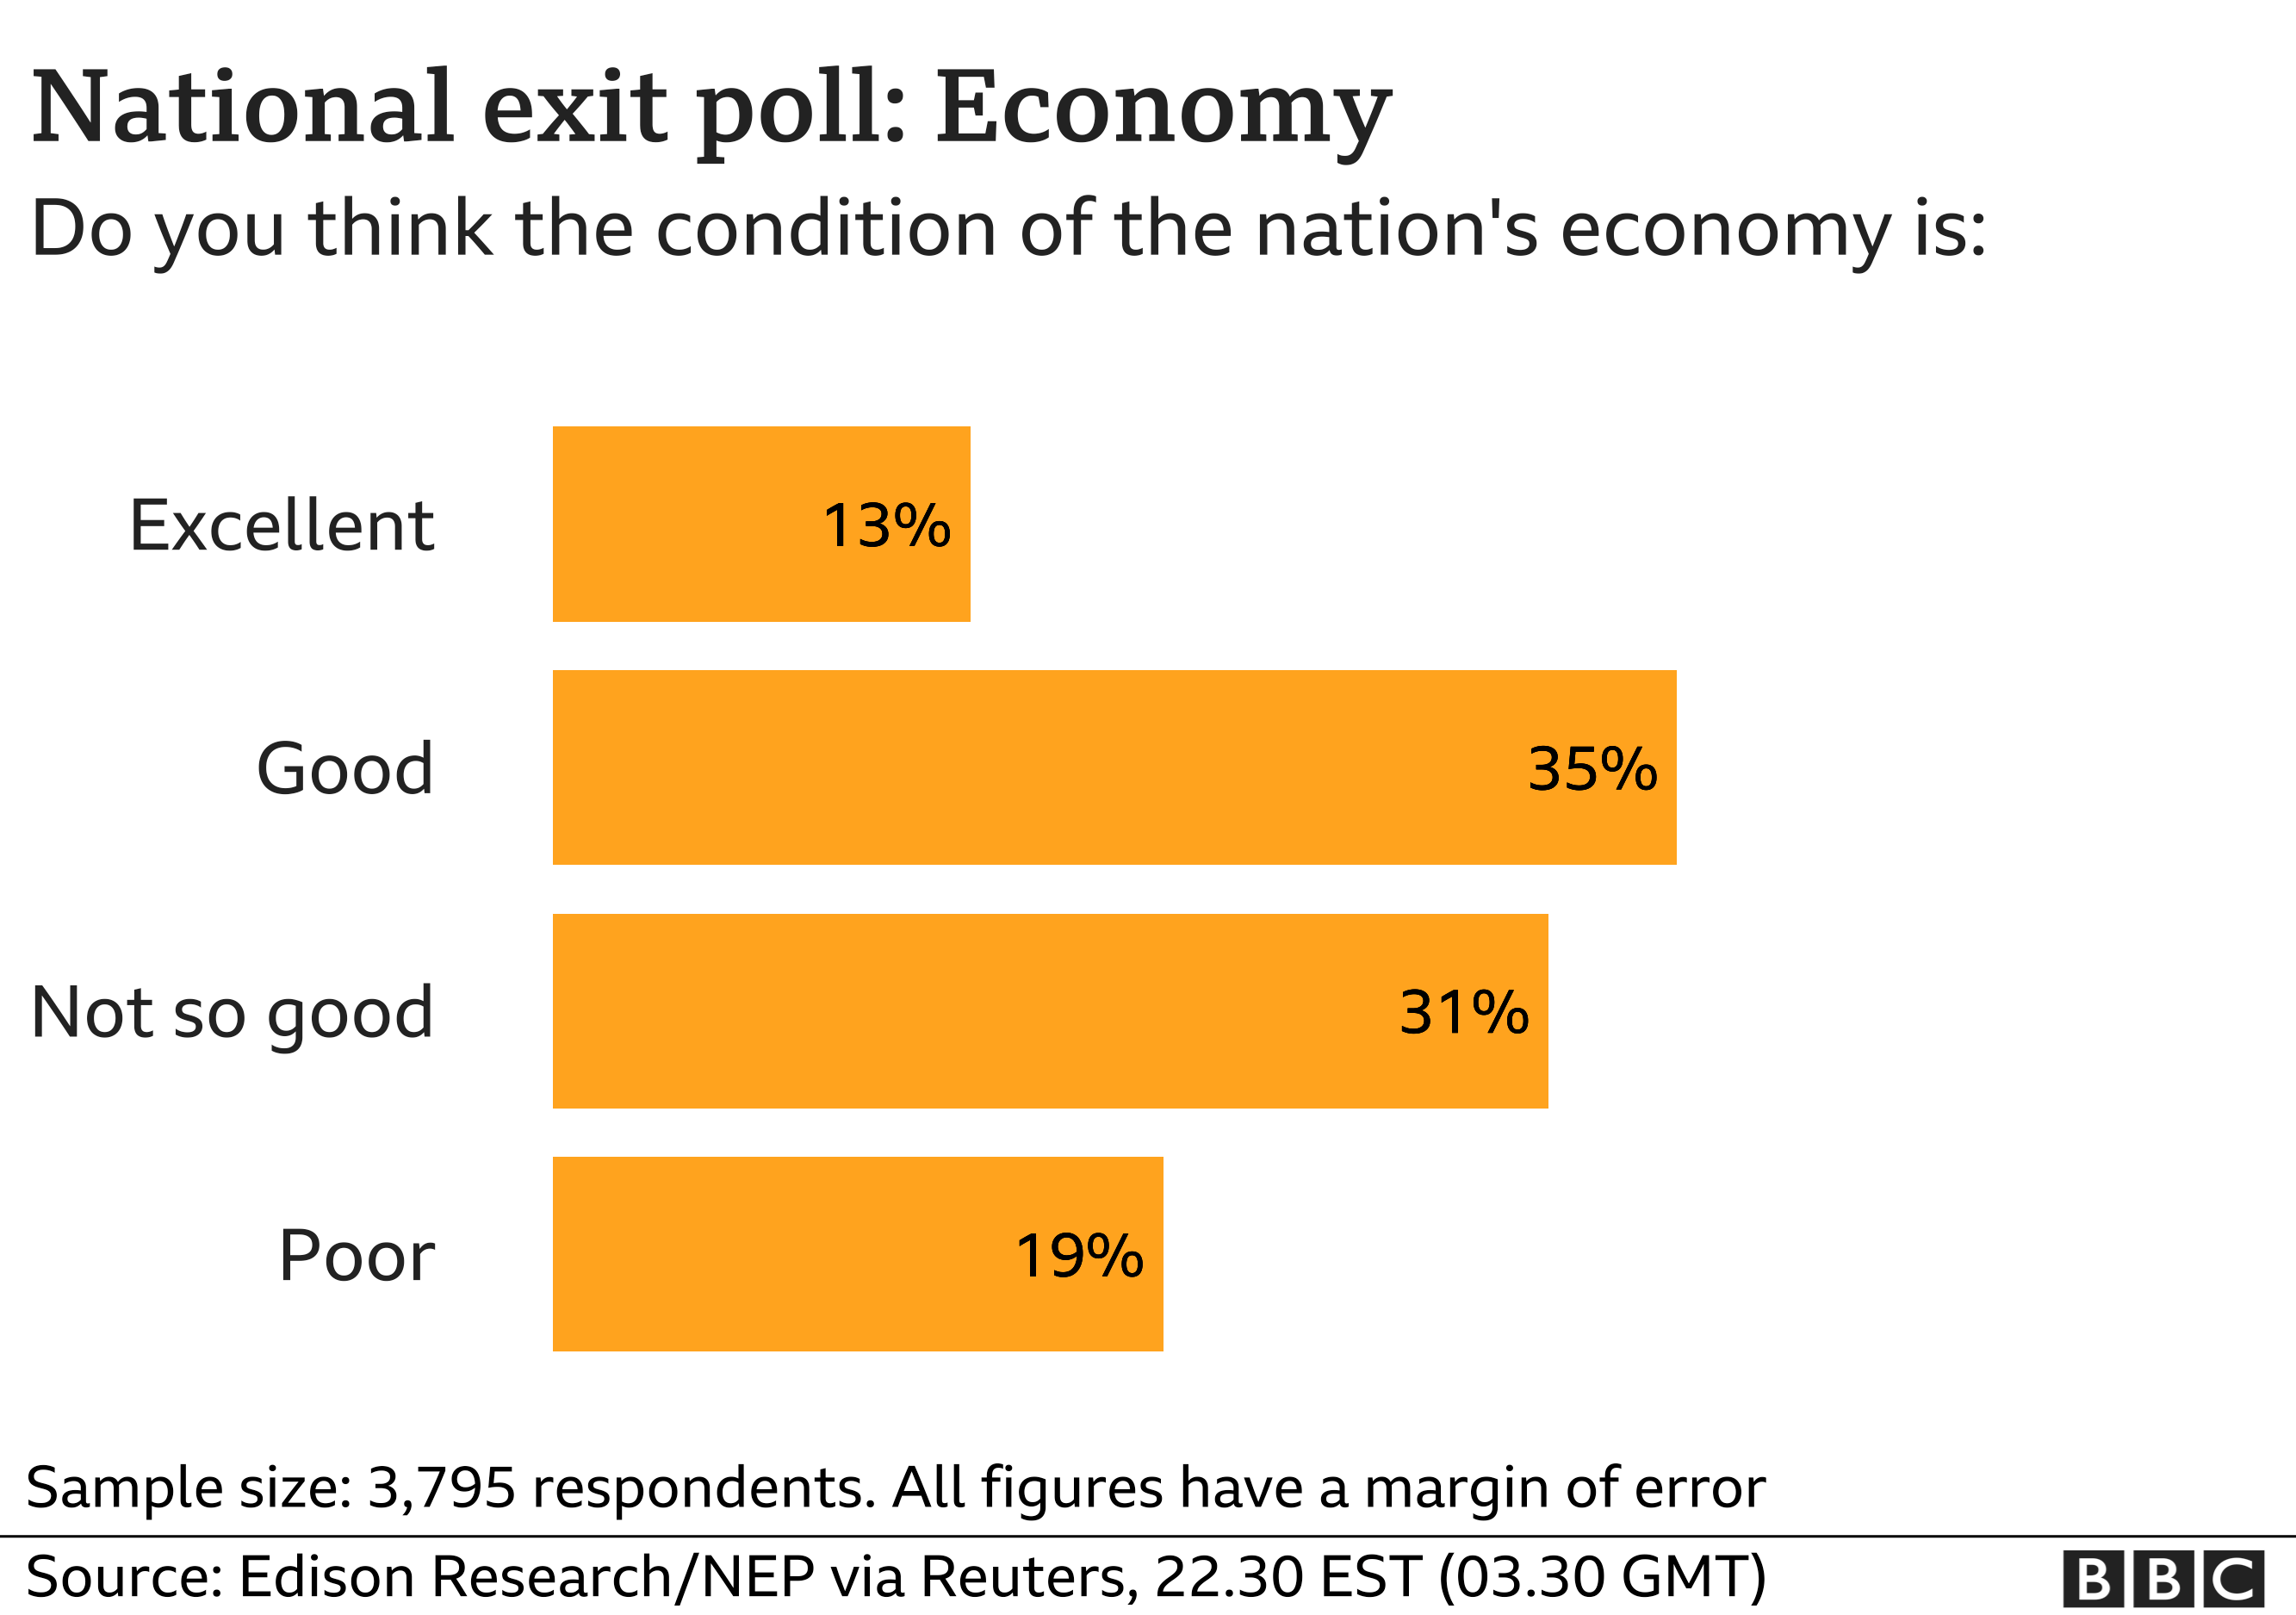
Voters were evenly split on how the US economy was faring, with 48% saying it was in “excellent or good” condition and 50% saying it was “not so good or poor”.
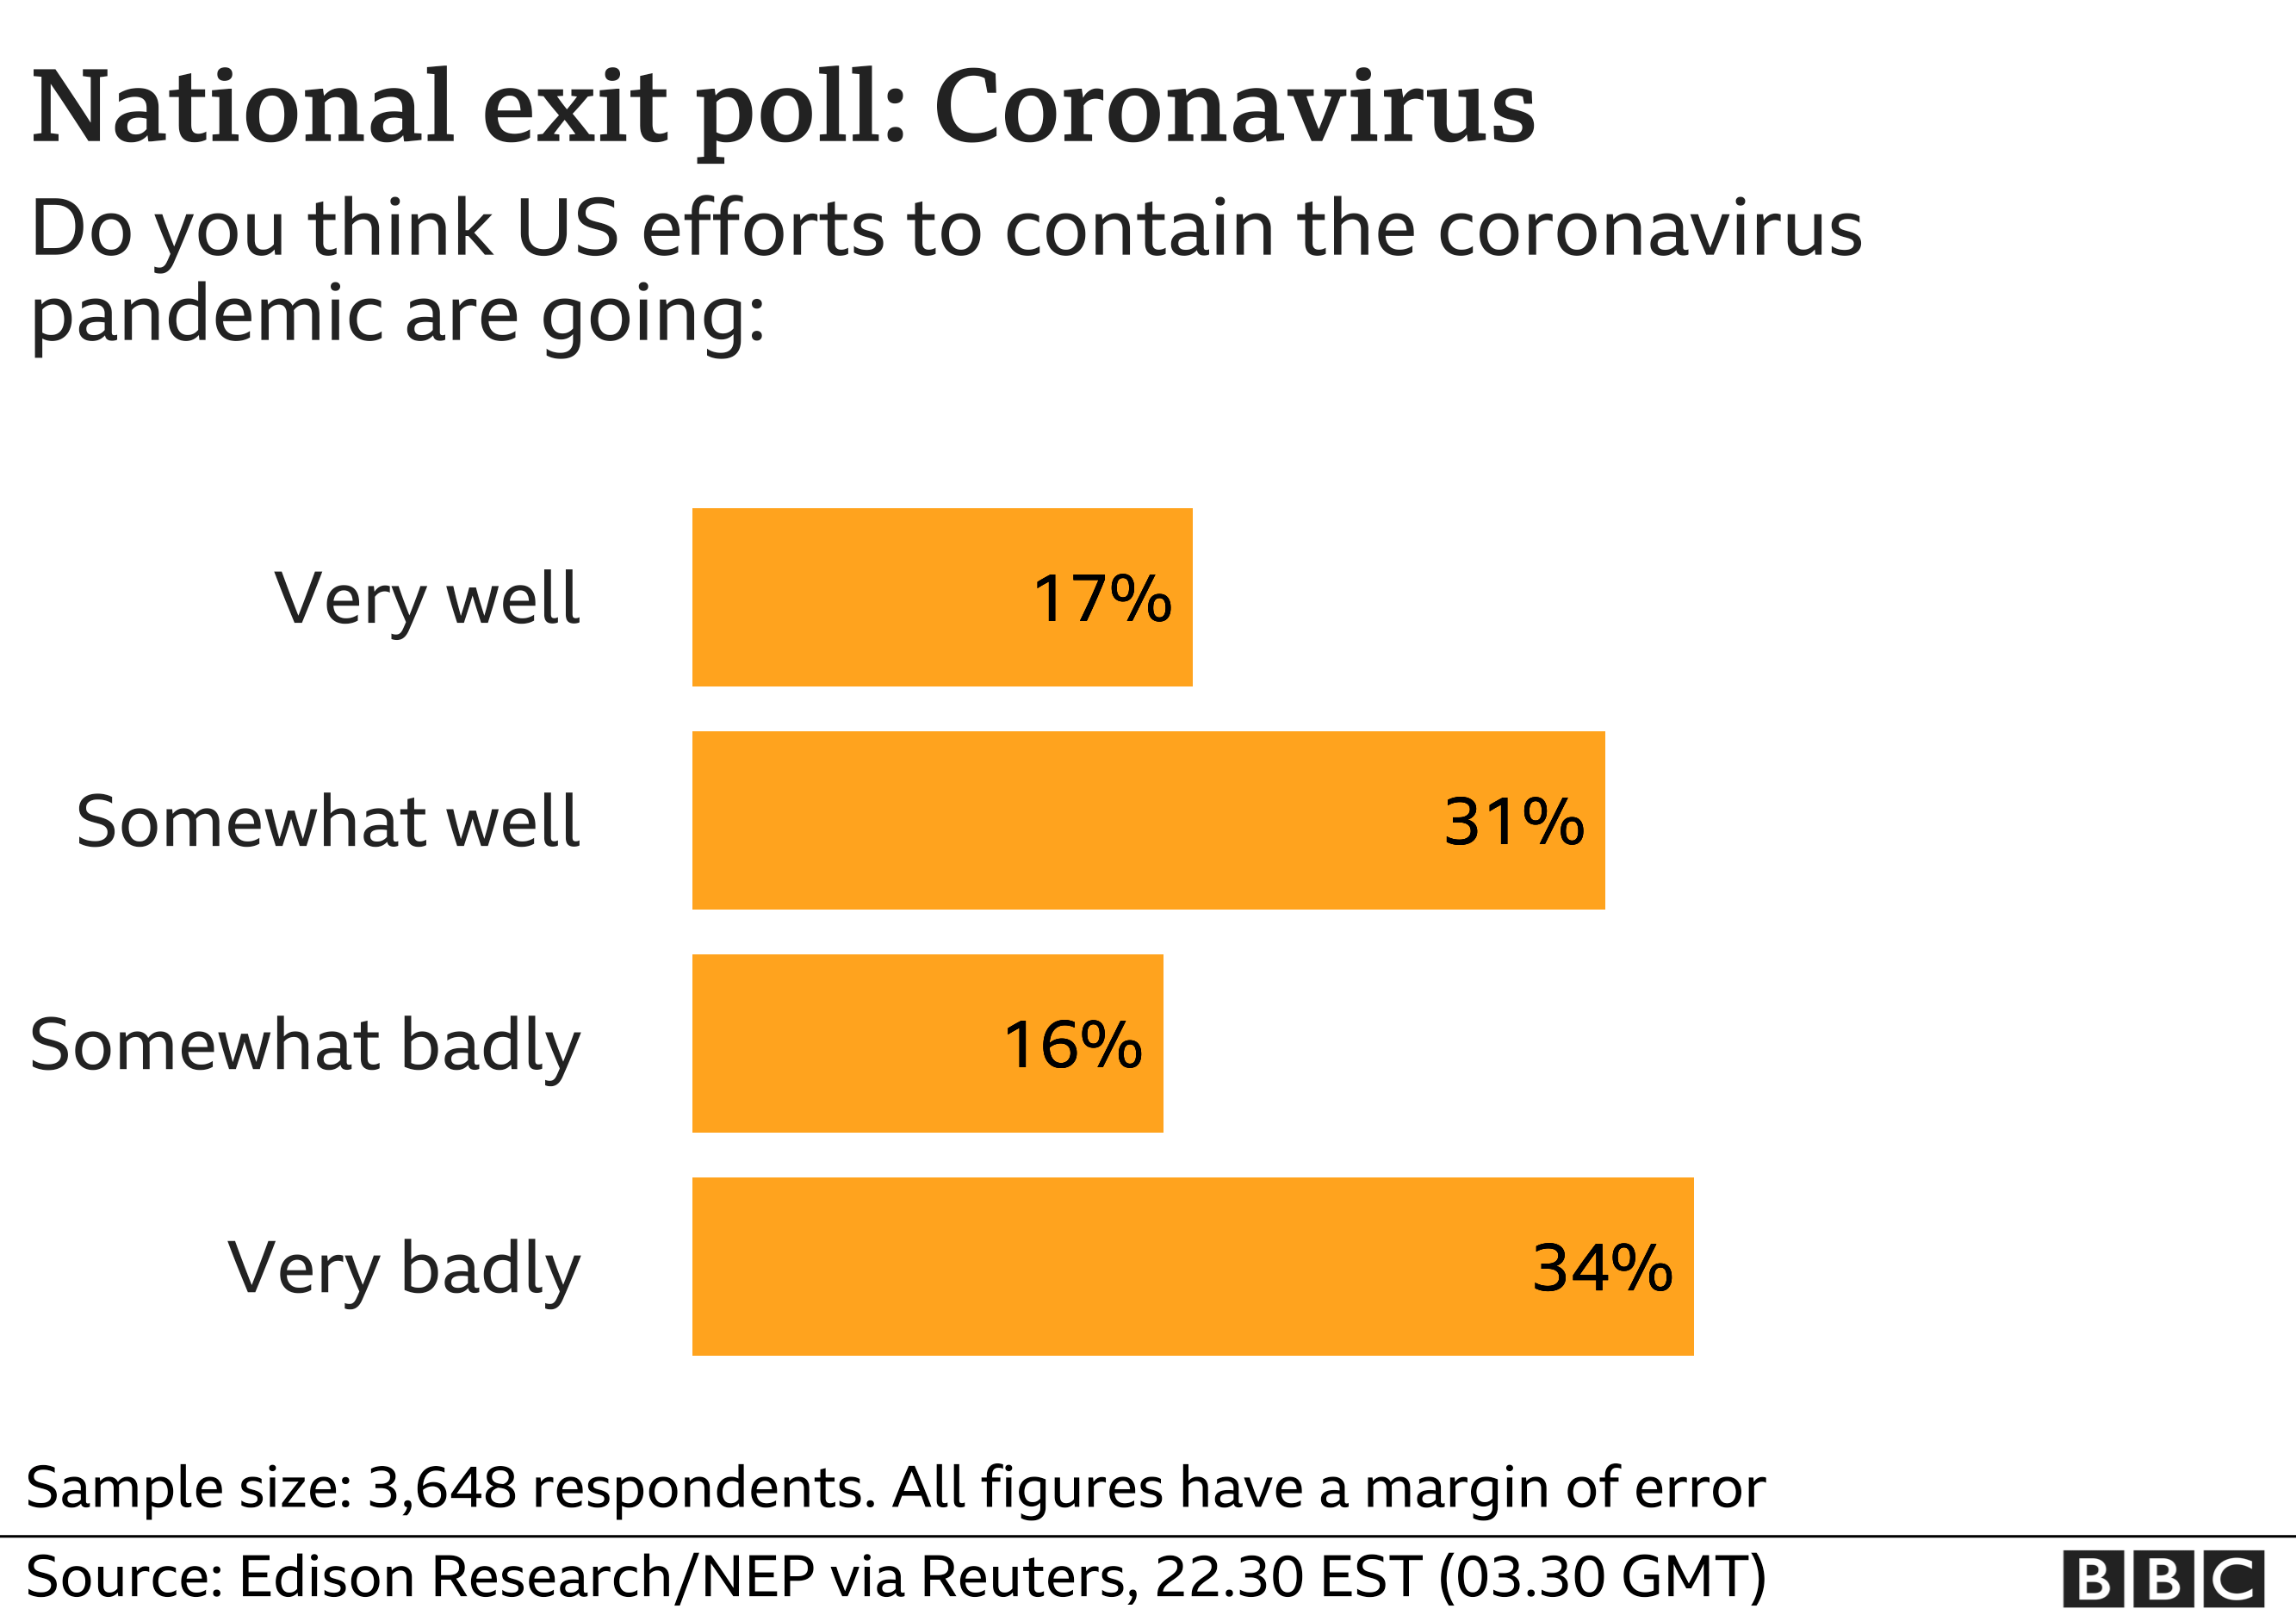
Similarly, 50% said that the US was doing “somewhat or very badly” at containing the pandemic and 48% thought the country was doing “somewhat or very well”.
The possibility of voter fraud has been raised repeatedly by the Trump campaign but a large majority of voters (87%) told the researchers they were confident that votes in their state would be counted accurately.
Animated map: The results so far

Methodology
The exit polls are made up of a national exit poll and 22 state exit polls which are carried out by Edison Research for the National Election Pool (ABC, CBS, CNN, NBC).
For the national poll, a total of 15,590 voters who cast ballots on Election Day were interviewed at 115 polling places as they exited the polling places. This survey also includes 4919 absentee and/or early voters interviewed by telephone.
The data is then weighted to be representative of the population and are adjusted further as votes are counted.
All samples are approximations and are subject to a margin of error which will be wider for small sub-groups such as smaller ethnic groups.

- How to follow election results on BBC News
- What to look out for on election night
- Who will be the next US president? You decide
- Full coverage of the US election
- A really simple guide to the US election
Source BBc
Comment